Monthly Archives: August 2013

August 2013 Viral Videos

9

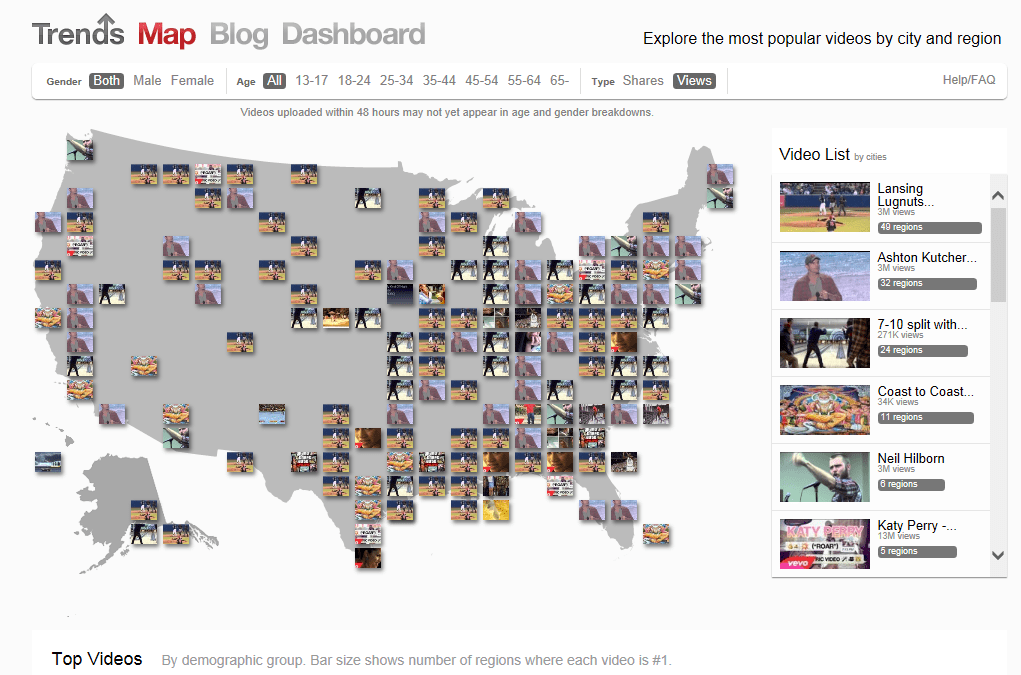
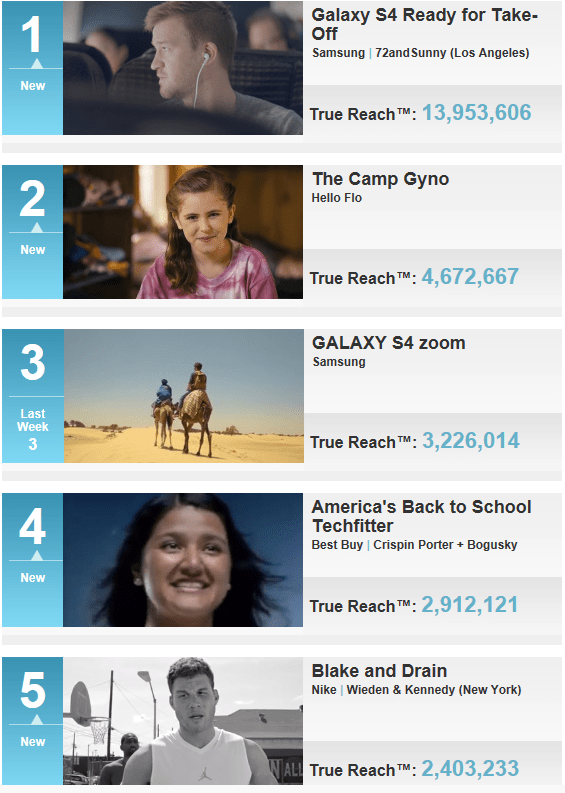
Every week Advertising Age, in conjunction with company Visible Measures, publishes a list of the week’s top performing videos. The weekly chart highlights viral video ads that appear on online video sites. Each ad measures viewership of brand-syndicated video clips as well as social video placements that are driven by viewers around the world. (A measurement called True Reach™ quantifies the total audience that has been exposed to a viral video campaign. The measurement combines data from brand-driven seeded video placements with results from community-driven viral video placements – spoofs, parodies, mashups, and more.)

There are three key factors for viral video success:

  1. Reaching the tastemakers.
  2. Building a community of participation.
  3. Creating unexpectedness in the video.

Regardless of the type of product or service, the country of origin, or the importance of the message, what matters is reaching the audience in a way the both entertains and informs.

Check out this week’s top videos and discuss what makes them “viral” – http://www.visiblemeasures.com/adage

Group Activities and Discussion Questions:

  1. Bring up Ad Age’s weekly Viral Video chart: http://www.visiblemeasures.com/adage
  2. Have students examine how the ads are measured by Visible Measures.
  3. Divide students into teams. Have each team select an ad on the top video chart and analyze the ad.
  4. What is unusual?
  5. Who will it interest?
  6. What is the key message?
  7. How effective is the ad at getting the company’s brand and message across to viewers?
  8. In teams, have students design a viral video for a product of their choosing. What are the elements that are needed to go viral?

Source:  Advertising Age, Visible Measures – weekly update

Leave a comment

Filed under Classroom Activities

August YouTube Trends Map

8

Everyone is familiar with YouTube, and likely we all watch a video or two nearly every day (go ahead, admit it). In fact, the video-sharing site averages more than one billion viewers each month! But what we watch varies by age, gender, geography, and more. The most popular video watched by men is likely not the same as the most popular video watched by women. And don’t forget about variations in culture across the U.S. The viewers in New York have very different habits than do viewers in Texas.

YouTube posts a daily trends map based on demographics as reported by its account holders. Rankings are based on the number of views and can be separated by age, gender, and location. Through the aggregated data, YouTube Trends show us the most popular video in real time and gives ideas about trends that are developing within the YouTube viewing community. The map is a visual representation of the most viewed videos over the past 24 hours across the U.S.

Before you look at it, take a guess. What do you think the most popular, trending videos are this week? Then click on the interactive map to discover trends and viewing behaviors.

Group Activities and Discussion Questions:

  1. Poll students: What are the YouTube videos they watch the most?
  2. What videos do they think are more popular for men vs. women? By various age groups?
  3. Bring up the YouTube trends map: http://www.youtube.com/trendsmap
  4. Divide students into teams. Have each team select a specific target market and geography and view the most popular videos in that area.
  5. Discuss how this information can be used by marketers.

Source:  YouTube.com

Leave a comment

Filed under Classroom Activities

“It can wait” PSA Campaign

7


Marketers have a lot of power to influence consumers habits – not only what the consumers buy, but also what the consumers do.  Think about the various public service campaigns that are around us – littering, drinking, driving, smoking, texting, and more. Each topic has PSA campaigns that try to reach the affected audience and influence behaviors.

One of today’s important and timely topics is texting and driving. More than 75% of teens say that texting and driving is common in their group. According to the National Safety Council, more than 100,000 crashes each year are attributed to texting and driving. It’s a significant problem in today’s “always connected” world where people think they need to always be on-line, no matter what they are doing or where they are.

To combat the problem of texting while driving, AT&T, T-Mobile, Verizon, and Sprint have teamed together to produce a joint campaign called “It can wait.” The collaboration has designed a new Web site, complete with pledge, information, a texting-while-driving simulator, and 35-minute documentary film by Werner Herzog.

Watch the video. Take the pledge. Make the roads a little safer.

Group Activities and Discussion Questions:

  1. Discuss public service announcement (PSA) campaigns. What makes them effective? What are some of the difficult issues developing PSA campaigns.
  2. Poll students: What are some of the issues that they have seen PSA campaigns for? What are some issues that could use better PSA campaigns?
  3. Show the “It can wait” Web site: http://www.itcanwait.com/
  4. What are the effective elements of this site? What is not effective?
  5. Have students run the “texting & driving simulator” at bottom of page.
  6. Divide students into teams. Have each team select an issue that could benefit from a PSA.
  7. Have each team develop a PSA campaign for the topic. What are the key elements? Who is the target market? What is the key message?

Source:  Brandchannel.com, 8/12/13

Leave a comment

Filed under Uncategorized