Monthly Archives: April 2015

YouTube Trends Map – April 2015

YouTube

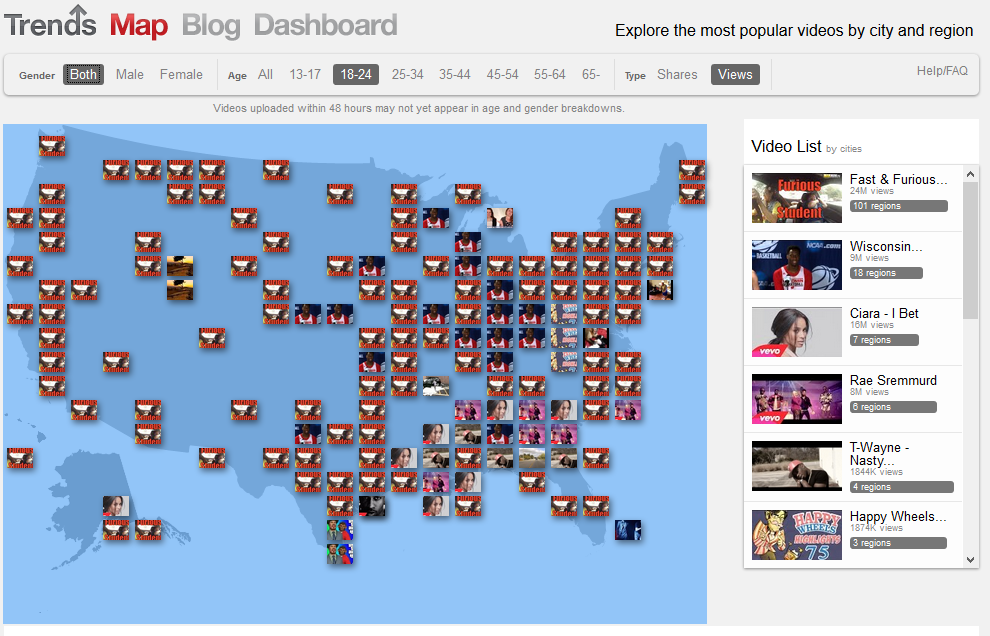
If ever we forget that there are distinct differences between genders, this month’s YouTube Trends Map really highlights the difference between males and females. Each month, we highlight recent YouTube trends, and each month the different groups (gender, age, and region) show different preferences. But, this month viewers really showed a dramatic difference in the most-watched videos, skewing directly along gender lines. The most popular video watched by males ages 18-24 (“Fast and furious nerd shocks instructors,” top in 71% of regions) was completely different than the video watched by females of the same age (“Monkey and his new puppies,” top in 19% of regions). What factors account for the dramatic difference, and how can marketers use this information?

YouTube posts a daily trends map based on demographics as reported by its account holders. Rankings are based on the number of views and can be separated by age, gender, and location. Through the aggregated data, YouTube Trends show us the most popular video in real time and gives ideas about trends that are developing within the YouTube viewing community. The map is a visual representation of the most viewed videos over the past 24 hours across the U.S.

Group Activities and Discussion Questions:

  1. Poll students: What are the YouTube videos they watch the most?
  2. What videos do they think are more popular for men vs. women? By various age groups?
  3. Bring up the YouTube trends map: http://www.youtube.com/trendsmap
  4. Divide students into teams. Have each team select a specific target market and geography and view the most popular videos in that area.
  5. Discuss how this information can be used by marketers.

Source: YouTube.com


Leave a comment

Filed under Classroom Activities

Best Global Brands of 2014

Videos

What is a brand? Does a brand have a financial value? These are critical questions that drive the strategic marketing decisions of corporations around the world.

In general, marketers define brand as the position that a company/product holds in the minds of the consumers. It follows then that if the brand holds a position in consumers’ minds, then it would definitely translate into a financial value for companies.

Each year, Interbrand does a financial analysis that seeks to define, in dollars, the value of a company’s brand – the result is the annual Best Global Brands ranking. In order to be included in the analysis the brand must be global – it must have successfully crossed geographic and cultural boundaries:

  • At least 30% of revenue must come from outside the brand’s home country.
  • It must have presence in at least three continents as well as broad geographic coverage in emerging markets.
  • There must be sufficient publicly available data on the brand’s financial performance.
  • Economic profit must be expected to be positive over the longer term, delivering a return above the brand’s operating and financing costs.
  • The brand must have a public profile and awareness above and beyond its own marketplace.Interbrand’s brand valuation methodology seeks to determine, in customer and financial terms, the contribution of the brand to the company’s business results. There are three key components in the methodology for the valuations: analyses of the financial performance of the branded products or services, of the role the brand plays in the purchase decision, and of the competitive strength of the brand.The results – well, see for yourself by viewing the interactive report at http://bestglobalbrands.com/2014/ranking/. The top global brands may surprise you.

Group Activities and Discussion Questions: 

  1. Ask students to define “brand.” What is it? Does it have value to a company?
  2. Have students take out a piece of paper (or write answer on laptops). Ask them to choose what they thing are the top 10 most valuable brands in the world. Then show the top 10 list from the Global Brand report.
  3. Bring up the Web site: http://bestglobalbrands.com/2014/ranking/ A video explaining the report is at: http://bestglobalbrands.com/2014/methodology/
  4. Show students several of the sections within the site and view some of the videos as a class. Discuss the overall findings as a class.
  5. Divide students into teams and assign each team an industry category to examine: automotive, apparel, beverage, electronics, energy, etc.
  6. Have each team present key findings from the industry sector they examined.
  7. How can these findings be applied in marketing strategies?

Source: Brandchannel.com, Interbrand.com

Leave a comment

Filed under Classroom Activities